এখন থেকে আমরা Elev8
আমরা শুধুমাত্র একটি ব্রোকার নই। আমরা একটি সর্বাত্মক ট্রেডিং ইকোসিস্টেম—বিশ্লেষণ, ট্রেড, এবং প্রবৃদ্ধির জন্য আপনার যা কিছু প্রয়োজন তা এক জায়গায়। আপনার ট্রেডিং উন্নত করতে প্রস্তুত?
আমরা শুধুমাত্র একটি ব্রোকার নই। আমরা একটি সর্বাত্মক ট্রেডিং ইকোসিস্টেম—বিশ্লেষণ, ট্রেড, এবং প্রবৃদ্ধির জন্য আপনার যা কিছু প্রয়োজন তা এক জায়গায়। আপনার ট্রেডিং উন্নত করতে প্রস্তুত?
Following its drop of more than 7.0% during the Asian session, WTI retraces losses to 4.6% while trading around $31.90 ahead of the European session on Thursday.
In doing so, the energy benchmark stays above 61.8% Fibonacci retracement of its pullback moves from Monday’s flash- crash low. However, a downward slopping trend line connecting Wednesday’s top to the latest, at $33.40, question the latest U-turn.
Should the oil prices rise beyond $33.40, $35.00 can offer an intermediate halt during the run-up to the weekly top near $36.60.
It is worth mentioning that oversold RSI conditions favor short-term pullback of the black gold.
Meanwhile, a downside break of 61.8% Fibonacci retracement, around 31.10, can take rest near $30.00 before diving deeper towards Monday’s low near $27.70.
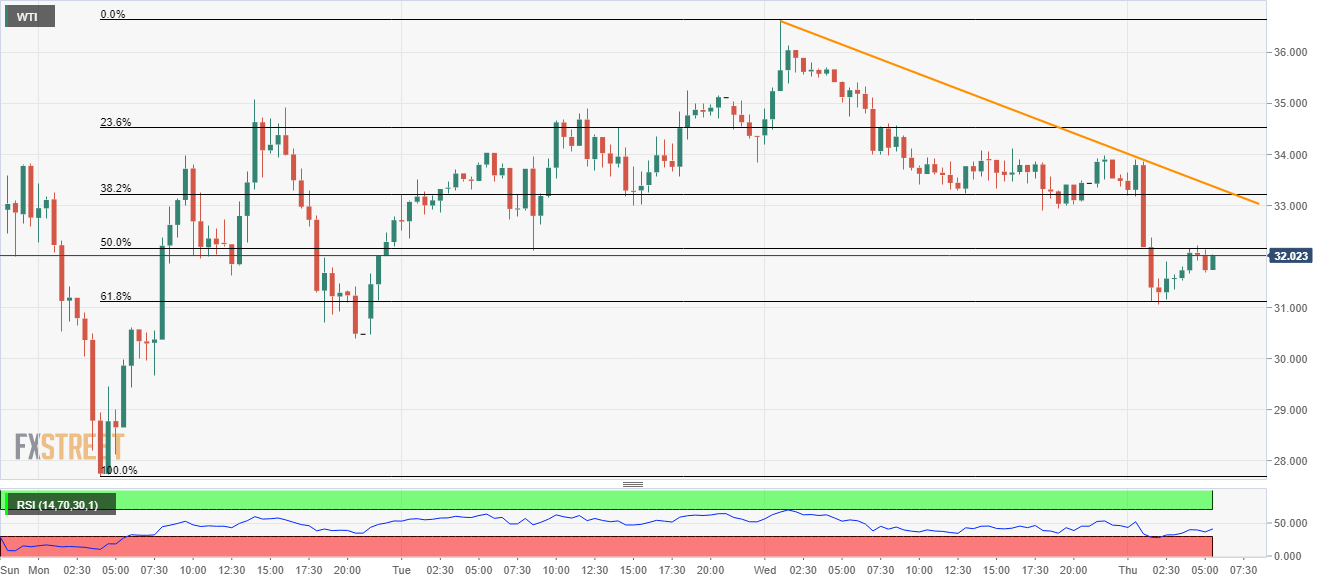
Trend: Pullback expected