Kể từ bây giờ chúng tôi là Elev8
Chúng tôi không chỉ là một nhà môi giới. Chúng tôi là một hệ sinh thái giao dịch tất cả trong một—mọi thứ bạn cần để phân tích, giao dịch và phát triển đều có ở một nơi. Sẵn sàng nâng tầm giao dịch của bạn?
Chúng tôi không chỉ là một nhà môi giới. Chúng tôi là một hệ sinh thái giao dịch tất cả trong một—mọi thứ bạn cần để phân tích, giao dịch và phát triển đều có ở một nơi. Sẵn sàng nâng tầm giao dịch của bạn?
USD/IDR’s daily chart Bollinger Bands – standard deviation of +2/-2 on price’s 20-day moving average – have turned flat for the first time since early December, signaling a neutral bias.
A close above the upper Bollinger Band at 13,757 would confirm a bullish breakout and open the doors for a test of the former support-turned-hurdle of 13,883 (July 19 low).
On the flip side, a breakdown below the lower Bollinger Band, currently at 13,596, would imply a continuation of the sell-off from highs above 14,300 observed in August 2019 and shift risk in favor of a slide to 13,500.
At press time, the pair is trading at 13,695.
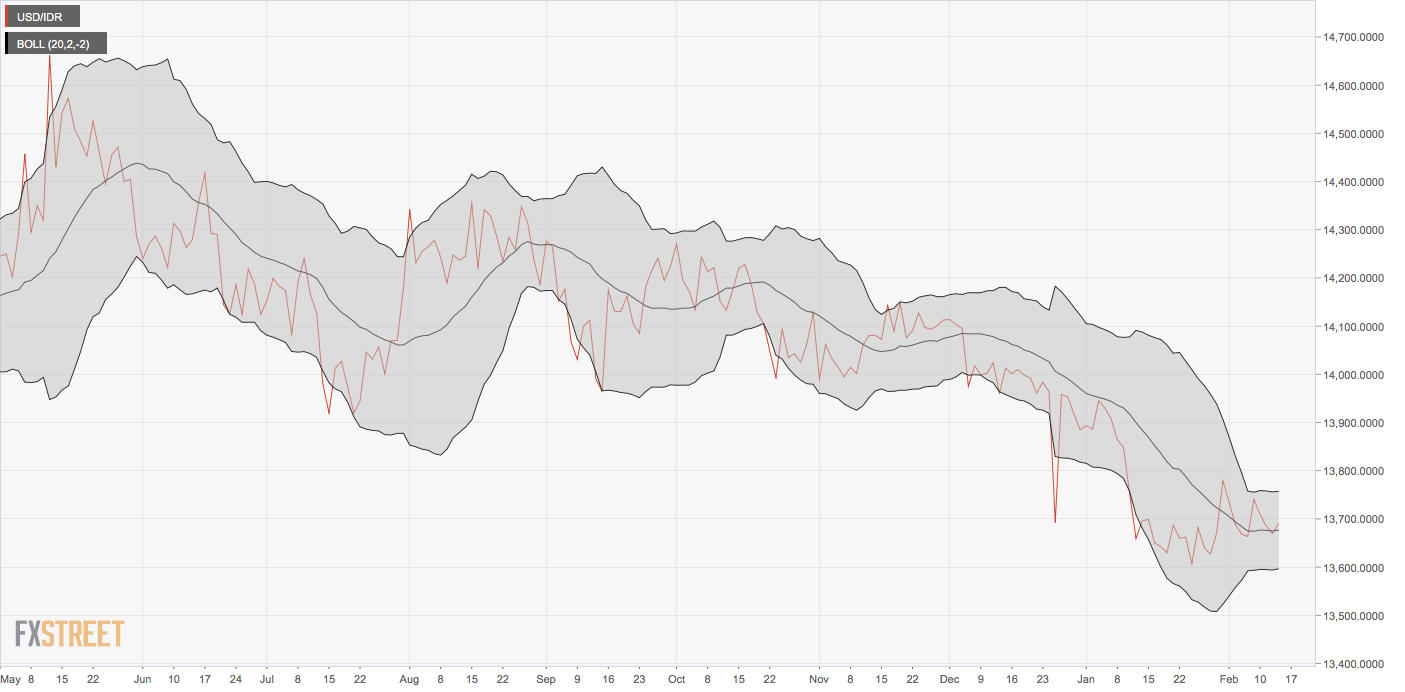
Trend: Neutral