Mulai sekarang kamiialah Elev8
Kami lebih daripada sekadar broker. Kami adalah ekosistem dagangan serba ada—semua yang anda perlukan untuk menganalisis, berdagang, dan berkembang ada di satu tempat. Sedia untuk tingkatkan dagangan anda?
Kami lebih daripada sekadar broker. Kami adalah ekosistem dagangan serba ada—semua yang anda perlukan untuk menganalisis, berdagang, dan berkembang ada di satu tempat. Sedia untuk tingkatkan dagangan anda?
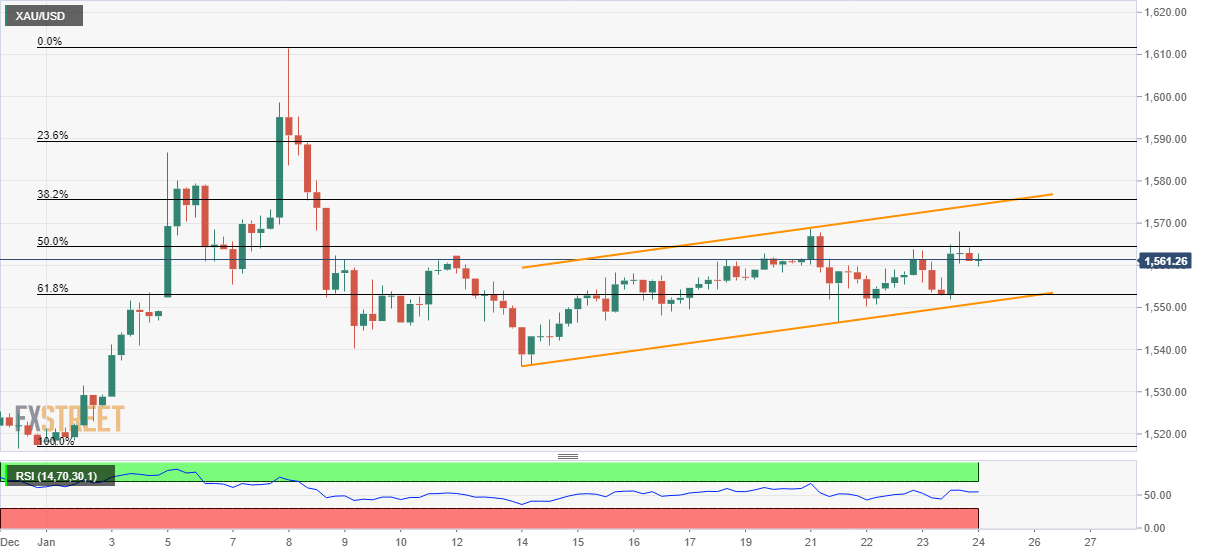
Gold prices lack momentum while trading around $1,561.50 during early Friday. Even so, the bullion stays inside a short-term ascending trend-channel formation that portrays the strength of the underlying momentum.
With this, buyers can take aim at the formation resistance surrounding $1,574.50 if managed to break 50% Fibonacci retracement of the early-month upside, at $1,564.50.
In a case where the bulls dominate past-$1,575, 23.6% Fibonacci retracement level of $1,590 can offer an intermediate halt during the run-up to $1,600 and then to the monthly high near $1,612.
On the downside, 61.8% Fibonacci retracement and the channel’s support line will question the sellers close to $1,553 and $1,551. Also nearing will be $1,550 round-figure.
Given the bears’ ability to rule below $1,550, the current month’s low of $1,536 and $1,530 could flash on their radars while $1,517 could grab the spotlight afterward.
Trend: Further recovery expected